Over time, we lose track of “What happened….?” Before that truck hit our precious metals investments. As far back as the 1950s, Secretary of Agriculture, Ezra Benson told us he would crush our speculation in Silver. Remember? I do. No change up to the turn of the century. A dominating imperial empire. This empire would keep its illicit fiat profits to itself as long as it could suppress profits for anyone else and expand its profits from war. Surprise, surprise, Greece, Rome and Britain.
So now what is different? We now can track cycles . !! Matters NOT if we do not exploit them. So when the GDX price popped from the low of $12.50 to the breakout of 13 (we waited for that !!). GDX subsequently ran to $45 US, a triple, almost a QUAD !! SELL @ 42-45.. Now that we have a reverse, that lets you buy in the 30’s . Just some, not whole hog, that is for later. You have to start with small bits. How far it may go or last, we can guess but do not know. But, we do know it is trending upwards.
Failing to satisfy you, your monthly subscription refunded ASAP, no questions. Our monthly DGS Letter, updates and bulletins for buys and sells when they happen, and our Good-Standing-Lists for less than you spend on coffee a month, price locked. Free e-mail reviews of relevant stocks on request.
Honest and real prices for Gold and Silver you can buy now, not paper prices.
US AGE Gold Eagles SOLD on Ebay averaging USD$ 2100-2150 shipping $25 for the most recent 10 sales.
US ASE Silver Eagles SOLD on Ebay, averaging USD$ 35, plus average $5-10 for shipping, most recent 20 sales on Ebay and dealers.
Using most recent dealer bid prices, I figure the Gold Silver Ratio at about 61.
Go here https://denaliguidesummit.com/to subscribe, $24.95. Give it a good “test drive” and if you’ve made your money, please renew, $49.95 monthly to repeat the profit process
What’s up lately ? Sibayne Gold SBSW – buy Oct 2019 @ $5
Doubled in four months. sold Jan 2020@ $10, now $15
Teucrium Sugar Fund CANE buy May 2020 @ $5.18, now $7.17
ORLA Mining OLA.To buy May 2019 C$ 1.70
Nice move sell Aug 2020 $ 7.00
Pure Gold Mining PGM.V buy Apr 2020@ C$1.00
Good move, good outfit sell Sep 2020 $ 2.60
Great Bear Mining GBR.V buy Sep 2018 @C$ 1.88 now $15.03
holding
Rupert Resources RUP.V buy May 2020 @C$ 1.26
good Scandinavian miner sell Oct 2020 @ 5.50
Those were some of my good ones. Here is one, killing me but worth the hold to me, BTU Metals Corp. BTU.V buy Apr 2020 @ C$ 0.16
hold @ $ 0.14
I know you cant win them all, at least not right away. Humans like me err.
Now what is on the horizon for investors like ourselves?
I expect accidents like the Fed blowing up on repo levels as in Sept 2019. For me the only valuation levels that can be made sense of will be for Gold, Silver and other Precious Metals producers. Explorers and developers will fluctuate a lot.
Our free content and emergency updates will always be on our blog. You won’t want to miss out our recommendations in your subscription on SubStack.
Information contained herein is for educational and informational purposes only. Investors are responsible to execute their own due diligence investigations to protect their capital. Publisher or associates may have positions in these stocks as well.
This is your basic README file for STRATEGY and TACTICS for PM’s and PM stocks. An orientation if you will.
My first basic rule, #1 for me, is SIMPLICITY. Simplicity in the approach to the trade, and simplicity of the trade itself. I only use long positions. Buying them to get in them, and selling them to exit the trade. Nothing to screw up.
Has worked fantastically for me. The one variation you may see, is where I buy a heavily dividended stock, and select a dividend reinvestment plan. Old fashioned I might be, but I like getting paid while my money is working, not just for capital gains. That is one slightly different category.
My job as the Editor and Publisher of STRATEGY and TACTICS is to execute
Due Diligence in selecting a stock with strong probabilities of an good return on your investment. Once I can tell a company is not in imminent danger of becoming insolvent in the time we are considering a position in its stock, my fundamental Due Diligence is resolved.
In twenty (20) years of working with Stock Charts, and other services, I have identified six (6) Clusters of individual measures (indicators?), avoiding measuring the same data (co-linearity) redundantly. These measures, in the clusters enable certain probabilities to be formed about the stock under consideration. Different stocks respond positively to different clusters. Those stocks that are unresponsive, get dropped from consideration.
So far I have written a lot of words. Lets get to what they mean :
The stocks I pick, when I pick them, if acquired in a timely manner have a
more than even chance of making you money. Here is where it gets serious:
If you don’t like my work for any reason, and you ask, I refund your monthly subscription fee, no questions asked.
We offer a stress-free, hassle free, environment for you to turn my 30+ years of technical analysis, and experience in the PM sector, into a way to profit.
It’s a risk-free way to see if you can use our methods for your profit. You don’t profit, we lose you and don’t make money. Again, very simple.
The chart below shows what we are up against, not being the 1%.
Dreams do come true, so to nightmares, for GameStop GME shorts.
What? From $12 to $365, and it ain’t over yet ?? OH MY.
Lets go with something more pedestrian and mundane, my last trade
in the retirement accounts. After having soul-searched for a suitable
vehicle for low intensity investment, I picked a Canadian Chemical Co,
Chemtrade Logistics, CHE/UN.To, which has tonnes and tonnes of debt securities, averaging close to a half million common shares a day. All was well and calm until the common went vertical, which of course cannot last, and I exited the Common Stock with a 25% profit in 6 mo, plus the dividends, which satisfied me, quite well. I simply cannot abide a stock going straight up, because I know what happens when it exhausts itself. While GGN was my next target, I had back-ups aboard in case my US Funds were transferred in time. Both my primary and secondary targets had forward div rates in excess of 8%, so I ended up with my first backup, a Canadian Fund specializing in regional debt. Lets see how that works out.
Lets see, Nanci (crazy nan) bought about a million dollars worth of TSLA and APPL LEAPS in December, expiring about March of 2022. Seems a wonderful coincidence that the “accidental” Junta leader Biden declares that the entire USA
Fleet would be ELECTRIC on the next cycle. Now that wasn’t bad for the market, was it ?
Well out of the political circle and back into mining stocks, seems this half of the GOOD-STANDING List is standing up pretty good:
Subscribers will get an additional copy with recommendations. Don t miss out, sign up at https://denaliguidesummit.com/. SUBSTACK readers will receive an a common conventions and orientation report as well for all. Below is a tidbit.
Information contained herein is for educational and informational purposes only. Investors are responsible to execute their own due diligence investigations to protect their capital. Publisher or associates may have positions in these stocks as well. CopyRight Denaliguide, DGS Publications, 2021-2022
One of the things I can recall bumpier than this weeks start, was the ride on the cargo rack of a Suzuki King Quad about 8 miles into the Steese Nat’l Recreation area at Beaver Creek, about 80 miles NW of Fairbanks, AK.
I anticipate the rest of the week will resemble the ride back out after a day glassing meadow for griz.
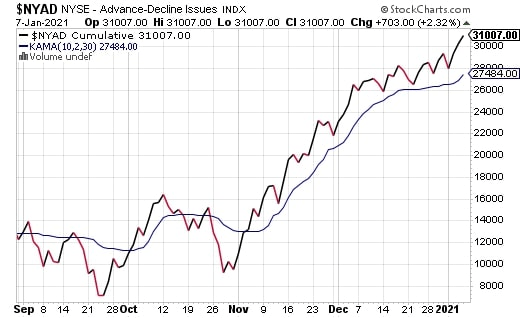
Well whether this was going to be the week which resolved everything or not, despite dizzying valuations, the markets decided to go on another little insane rally, as illustrated by the NYSE Net Advances – Declines Line rendered thus:
Looks pretty flashy to me. Then to confuse the picture here is K2 PM chart:
Confused yet, with the NYSE and the Precious Metals in parallel sync?
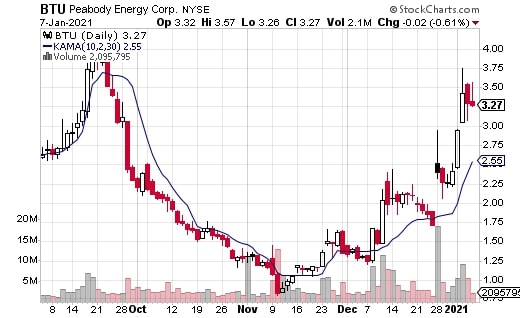
Kind of reminds me of Zimbabwe and Venezuela markets going nuts trying to adjust for what the markets anticipate as future inflation which seems the only rational answer so far. Then there is this one, Coal Miner #1, on a rip. Remember Coal? Everyone hates it, not? Well maybe not everyone:
Love it or hate it, its one ripper of an upside breakout. So there you have some of it.
Also for those paying attention, copper, lithium, uranium, silver, gold and P.M.s, generally on a rip. A favorite but poorly known graphite developer, of mine is NOU.V, New Moon Mining, run by whom I consider to be a real go-getter, Eric DeSauliners. Take a look if you like long shots, gambler’s bets and long shots.
First Majestic, in the silvers is a lead whom I like, and Nevada Copper, are a on a breakout, again on your own due diligence.
Don’t want you to miss out on our next Recommendations, and Tactical Insights, so sign up and come aboard for gains in our January Issue, out the end of the month..
Did any of this make any sense to me? In the greater part, I was incredulous at the insane valuations of the DJIA style markets.
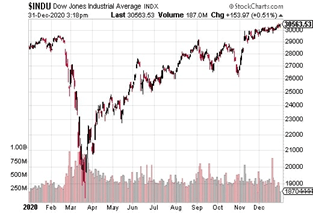
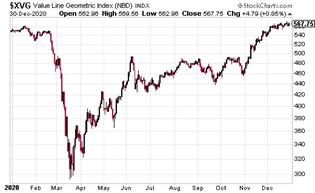
First on the left is the DOW, on the right is the Average Stock that you or I might own. Did you notice they went up in lockstep, and were equal at the end whereas
our average stocks usually lagged. Apparently the insanity is contagious or the markets knows something we don’t. Apparently as well, the market for Metal Gold and for Senior Gold Miner Stocks knows something also.
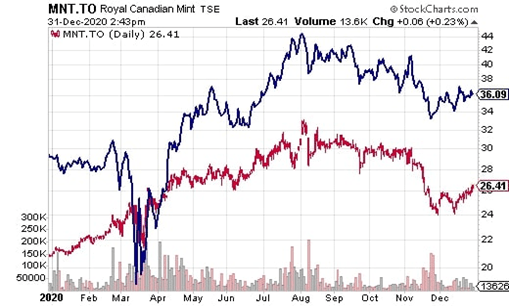
The BLUE line is the GDX, index of the Senior Gold Miners.
The RED line is the price of the Canadian Royal Mint’s Gold Metal inventory of .9999% gold used to mint the RCM coins. There have done more or less the same thing, arriving at the same place, about the same time as the DJIA and our Average Stock.
Thank goodness Bitcoin is going thru the roof, taking pressure off REAL GOLD METAL prices so we can still buy some before the price skys on us.
TALKING SENSE
DEC 31, 2020
Won’t there always be Gold to buy in Bullion Coin form ? Yes but at what price ? The fractionaRCM Gold coin I bought back in 2015, when everyone was sure Gold was going to break down and go to Hell in a hand basket, has doubled since then, with no attention from me. Its resting comfortably. Silver on the other hand has been an uneasy rider from that point forward, the bullion coins returning to their post mania plateau of days past, only this year. So were are we at: Gold has doubled, and Silver is back where it was in the years following its Post-Mania correction.
Where does that leave us. I hope, balanced between assets in Silver, and assets in Gold. Gold Miners, and Silver Miners are going to fluctuate with wars and rumors of wars. Always. What can you do, what should you do?
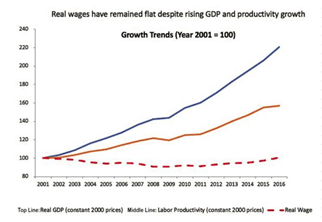
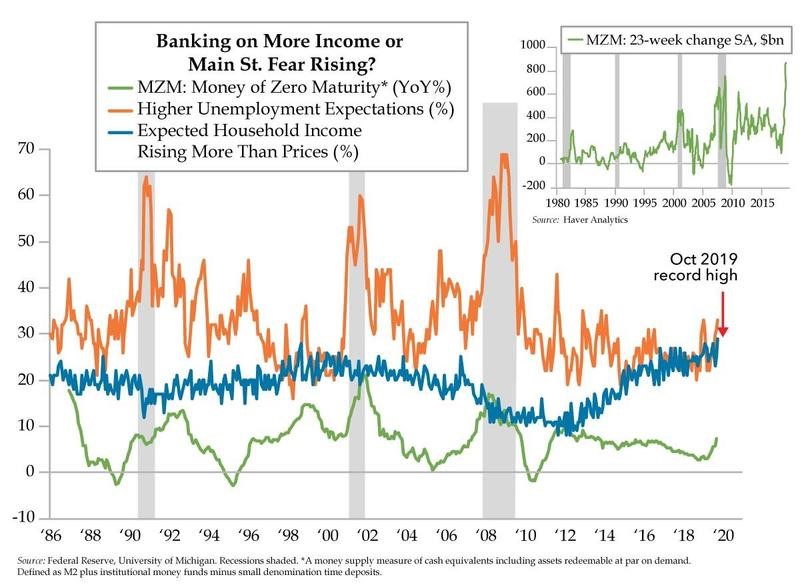
Protect your assets. Looking at all the data, you can see that families without assets, depending on wages, once adjusted for inflation and cost of living, have been impoverished by declining wages by Fed’s own charts and data. Should you be in stocks? Would you go out in the jungle or on the Arctic tundra as a rookie, or without a guide who knows the territory? Would I send the uninitiated out to the slaughter with no remorse. NO, NO and NO.
Look around, consider a free copy of the common sense, easy to understand “DG Letter” Straetgy & Tacktics by dropping me a note to “DenaliguideX@Protonmail.com, and requesting a free copy. See if it is as simple and easy to understand as I been striving to make it. It might make a difference for you, and your family. If you like it you may wish to subscribe to it, which is back by a no-questions money back satisfaction guarantee.
You have seen seven years of surpression instigated by the loss of the USA’s AAA debt rating, as Gold was hitting highs, ratting out the FED and US Treas, that this was OK. We can see by this time it didn’t turn out so well. The GDX plunged 50 points, from 62.5 to 12.5, where it refused to budge. This took the Gold Miners Index to the bottom where the US Govt shut down the Miners in 1942, arguably the lowest point of WWII, an 80% drop, where the GDX refused to break and bottomed out. In my opinion, this was the direct result of whom I suspect was JPM acting as agent for the Exchange Stabilization Fund (ESF), a sub-unit of the US Treasury, sold the equivalent in paper forward contracts, of Newmont Mining’s most recent two years of production, in ONE DAY. As a result the real Metal Gold price, and holders, bambozzled by this smoke and mirrors act, reversed the trend which ended at 1049 US, the price of the “India” put.
In the aftermath of this sham, Gold Metal real, broke out of its old high, and registered a new one this month at 2050 US, and the GDX ralled from 12.5 to 45.40, 363%, or a bona fide triple, with more in the offing as it digests this gain. Seems as if further gains are to be had by those who can stay in the Gold Miners without getting shaken out by intra-day shenanigans.
Yes the beginning was long ago, and not 2012 when the USA credit rating was downgraded. Events can trace back to 1971 when Nixon removed gold convertability from the US Dollar, to 1933 when FDR took the USA’s gold private, and on and on. It matters not at all, zilch, zero, because this is now. 2020, when financial fundamental shenigans distortions finally came into open view.
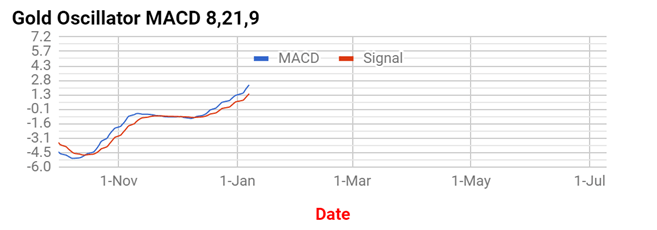
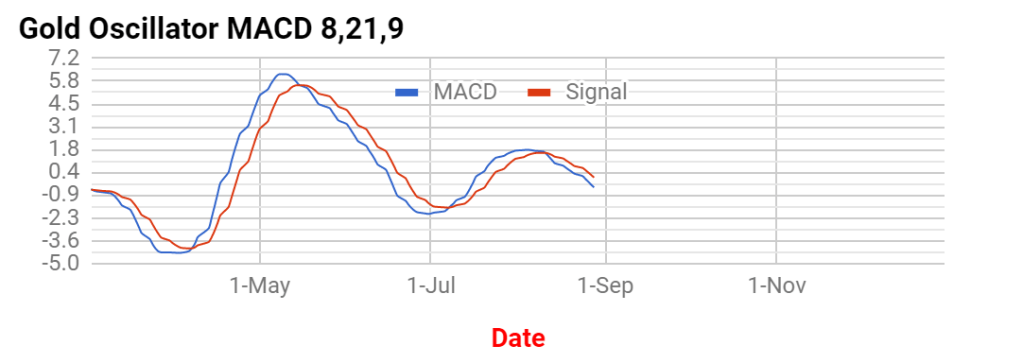
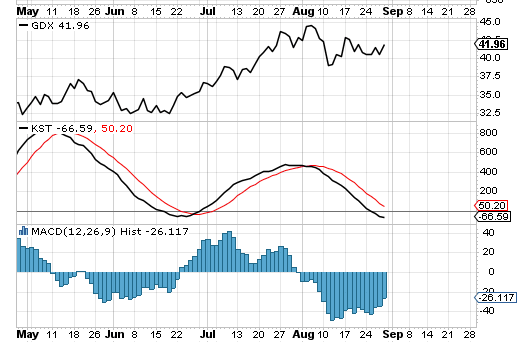
What happens now / next ? Here are two different momentum charts based on the breadth of the GDX, showing a new uptrend likely to start in September, in my opinion.
And #2
The middle figure is the clearest in terms of momentum movement, which allows you to see what I think is an imminent turn-up from the downtrend or flat correction from July, into an uptrend sometime in September. I won’t belabor the obvious, and tell you what I think you do, because I think if your reading this your savvy enough to know.
Get a free copy of August’s letter, just mailed, and sign up now on our “sale” ,if you like our work. No subscription risk, money back if you’re not satisfied.
It’s as clear as a bright sunny dawn, that multiple financial failures are what is draining all the cash the FED is putting out as repo’s. That’s probably not the sun you see coming over the horizon but the closest nuclear meltdown of a bank or derivatives bomb. Maybe its Deutsche Bank’s meltdown from the money it advanced Bayer to buy Monsanto.
So unless you are a Friend of the FED, how do you tell the players. They don’t sell player programs to the public nor do they post the game times or timeouts.
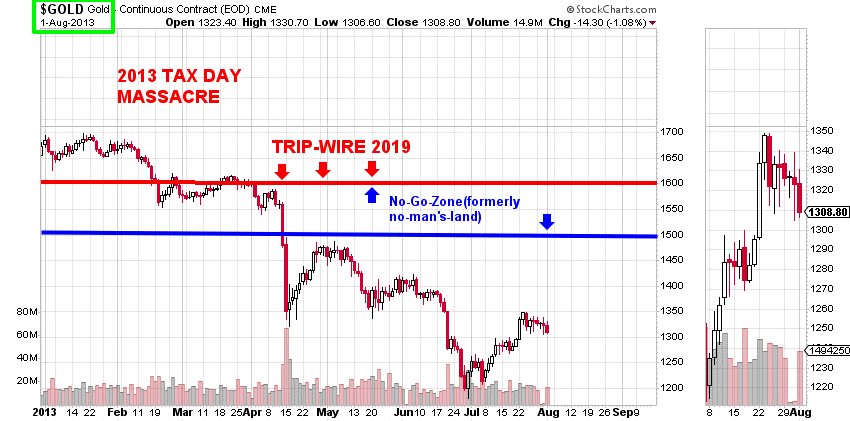
Back in 2013, someone, probably with the $ and blessing of the ESF (Emergency Stabilization Fund)(sometimes employing JPM as agent) hammered Gold and related products down in the TAX Day 2013 Massacre, so far in fact that there is still a gap unfilled from six+ years ago. The gap shows up a lot better on smaller interval and Gold Stock charts.
Many, many stocks show gaps, as yet unfilled waiting to be an island bottom, to include GLD, SLV and RGLD.
So now we play this waiting game, as Gold bottoms out again, and the Fed floods the globe with “play” liquidity, supporting positions that have already popped but cannot be revealed to the public lest they “lose confidence”.
Due to the untold trillions the Fed has already pumped in during the last two months the bank charts looks as if there are in no short term danger. Long term, what pops is anyone’s guess, so much has been pumped up so far.
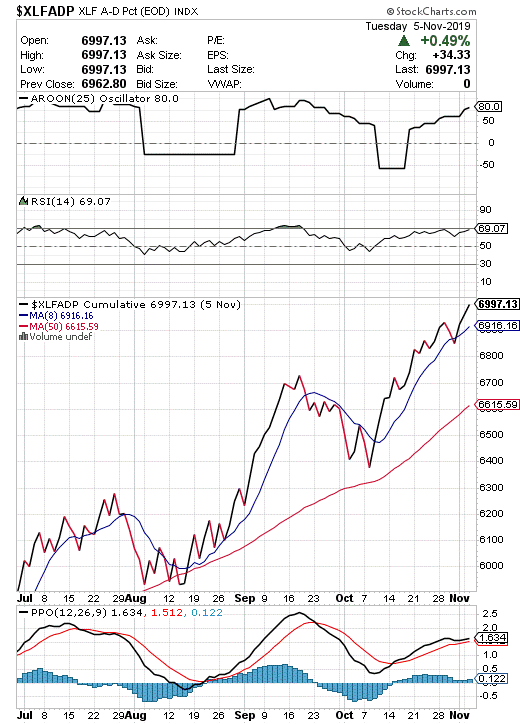
Lets focus on what we can use to tip us off when things start breaking down. Using some Indexes of Banks stocks not in the public eye.
First is a Community Bank Index on Nasdaq, QABA, then FTXO, theNAZ Bank Index, comparable to BKX, and also $BKX, then XLF, the Financials.
For right now, the Financials, the broadest net out there, cover what we need to see.
Basically JPM paid down its loans, with 130 Billion Dollars of reserves, and poured the rest of the funds into bonds, causing the deficit of lend-able reserves that then caused the spike in over night money, and gave the FED a great excuse to “NOT QE” half a trillion a week into the over night funds market, on a continuing basis. Hmmmm ? Was it planned or coordinated. IMO, probably not. Did JPM know the FED would backstop or bail them out? Based on past experiences here, I’d say they bet on that big time!!
Like I say, “Its your money, you decide!!” My call here is the FED will keep on bailing anyone and everyone, foreign or domestic, until they can’t. Where does that leave you? I am always on the watch for incorruptible mediums, not subject to watering down, meddling, or inflating. There are a number of these mediums available, but generally not pushed by the mainstream paradigm. A historical quote says “Seek and ye shall find.”, I think it is right. DG
Oh its Tuesday, (Friday) yes another bank just crapped out. Sixty (60) Billion this time? No its bigger, ninety (90) Billion this time.
What we got here is a serial implosion down the daisy chain. Whoops there goes another 100 Billion rat-hole!!! Hey, isn’t it only one a week? OK, some weeks its only 60 Billion!! Maybe its only ¾ of a Trillion annually, hey, its NOT QE, right? Well, maybe its a derivative, that went the wrong way. Or a Whale Trade against the oil price, which drained a Hedge Fund. Does the “Ping Pong Ball, Mouse Trap” detonation scenario bring anything to mind? Look it up on YouTube. Maybe the song “HIGH HOPES” done by Sinatra expresses it best.
It was an insurance company in 2008. In UK, it was Northern Rock Savings. With the FASB accounting board OK’g valuation at mark to fantasy, is this is any surprise that the banks and other institutions are using 300 to 1, or more leverage? With serial meltdowns up and down the daisy chain, it seems to me, that even if the FED moves to fill every hole it can find Some hole, somewhere, sometime will go unobserved, like the lurking subsurface fire after a lightning storm, that emerges in a conflagration that grows exponentially until it exceeds the capacity of the firefighters to bring it under control.
What can the “monetary authorities” do to alleviate a crisis, leading to unstoppable sequence of events. Short of an alien invasion on the scale of “Independence Day”, I don’t think there is anything that can be done that will neutralize a financial failure orders of magnitude larger than witnessed in 2007-2010. In September, the over night rate spiked from 1% over night, to 8% over night and it took a FED injection of 100 Billion to calm it down by the end of the month to the 2% level. Bottom line? Banks are not trusting each other to lend to, over night. Same symptom as 2008. Will the sequence be the same ? Likely not. Will it follow similar lines? It might. But the tune will be the same.
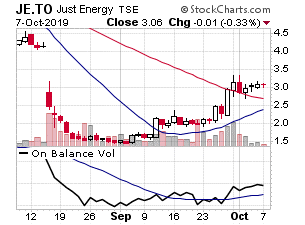
This is what it may look like if the
serial meltdown of the financial daisy chain gets out of hand:
Red in this
chart is the 50 day simple moving average. Blue on this chart is a 20 day
simple moving average. I call this a
Double Crescent Formation. This is an
example of a “price” set up, with the two moving averages in upturning
crescents. On-Balance-Volume in this set
up is not optimal. Optimum for
OBV would be if it was turning up in the same measure as the Blue line, the 20
day simple moving average. A note here
is that JE often moves counter cyclically but with weak cycles, so at times it
may not react as in an optimum “set-up”, but I liked the Double Crescent
Formation to illustrate.
This is not
a recommendation, but an illustration, to help you recognize this kind of set
up when you run across it. We will
discuss other types of set-ups and where to look for them in future posts. Good Luck,
DG